


MgO Price Trajectory Analysis and Forecast (H1 2025–2026): From Stability to Structural Shift
1. Introduction
In H1 2025, China supplied approximately 76% of global MgO exports, reflecting its scale, access to magnesite ore, and large-scale calcination infrastructure. This report analyses China’s export pricing, underlying cost structure, and forecasts pricing trends for H2 2025 and 2026 based on customs data and energy-and-ore market dynamics.
2. China’s Export Leadership and Competitive Price Advantages
2.1 Raw Material Integration
China controls over 85% of its domestic magnesite reserves—approximately 3.5 billion MT—centred in Liaoning and Shandong provinces. These high-grade deposits, often exceeding 46% MgO and accessible via large-scale open-pit operations, ensure feedstock costs remain 18–22% lower than those of import-reliant countries. For example, Israel’s Haifa Group sources magnesite from Turkey and Jordan, incurring substantial cross-border logistics fees, while Brazil’s mines in Minas Gerais require inland transport before export. The vertically integrated supply chain in China—from pit to port—avoids such intermediaries, enhancing cost advantage, especially given MgO's reliance on high-grade ore and energy-intensive calcination.
2.2 Energy and Processing Efficiencies
China’s MgO industry benefits from superior energy optimisation and industrial scale, particularly concentrated in Liaoning and Shandong provinces. Plants in these regions typically deploy advanced rotary kilns with AI-driven thermal control, achieving processing capacities of 1,000–1,200 metric tonnes per day. These kilns maintain stable calcination temperatures above 1,500 °C—required for high-grade MgO production—with temperature variation controlled within ±5 °C. Coupled with integrated waste-heat recovery systems, these facilities maximise fuel efficiency by preheating incoming magnesite using flue gas streams, reducing total energy input per tonne of MgO produced. According to equipment manufacturers and industrial design firms, such thermal systems deliver energy efficiency gains of approximately 15–20% compared to German counterparts, where plant scales are smaller and environmental retrofitting is more advanced but cost-intensive.
Furthermore, China's production clusters benefit from bulk coal procurement and regional power sourcing advantages. In areas such as the Liaoning–Jiangsu corridor, bulk thermal coal procurement contracts allow for average energy input costs in the range of $580–600/MT of MgO output, whereas in Germany, comparable costs exceed $720–750/MT due to reliance on high-cost electricity and regulatory carbon pricing. This cost delta—driven both by input fuel pricing and scale-related energy intensity—translates into a significant price competitiveness advantage for Chinese exporters. It is also worth noting that German plants often face 20–25% higher specific energy consumption per tonne of output, largely due to fragmented production networks and stricter emissions constraints under EU frameworks.
2.3 Logistics and Port-Side Throughput
MgO manufacturing clusters in Liaoning and Shandong benefit from immediate access to deep-water ports such as Tianjin and Qingdao, which handle over 8,000 MT/day of bulk materials. This streamlined supply chain bypasses inland trucking and rail, which burden Brazilian exporters like Magnesita in Minas Gerais, where multimodal logistics can add $20–25/MT to FOB costs. In contrast, Chinese operations handle loading and shipping at port-side plants, with direct pipeline and conveyor connections that sharply reduce both time and cost per tonne. Combined with export rebate schemes (~7–9% of value), Chinese FOB prices remain 10–15% below Brazil, Germany, and Israel.
3. H1 2025 Price Volatility: Relative Stability Despite Sectoral Shocks
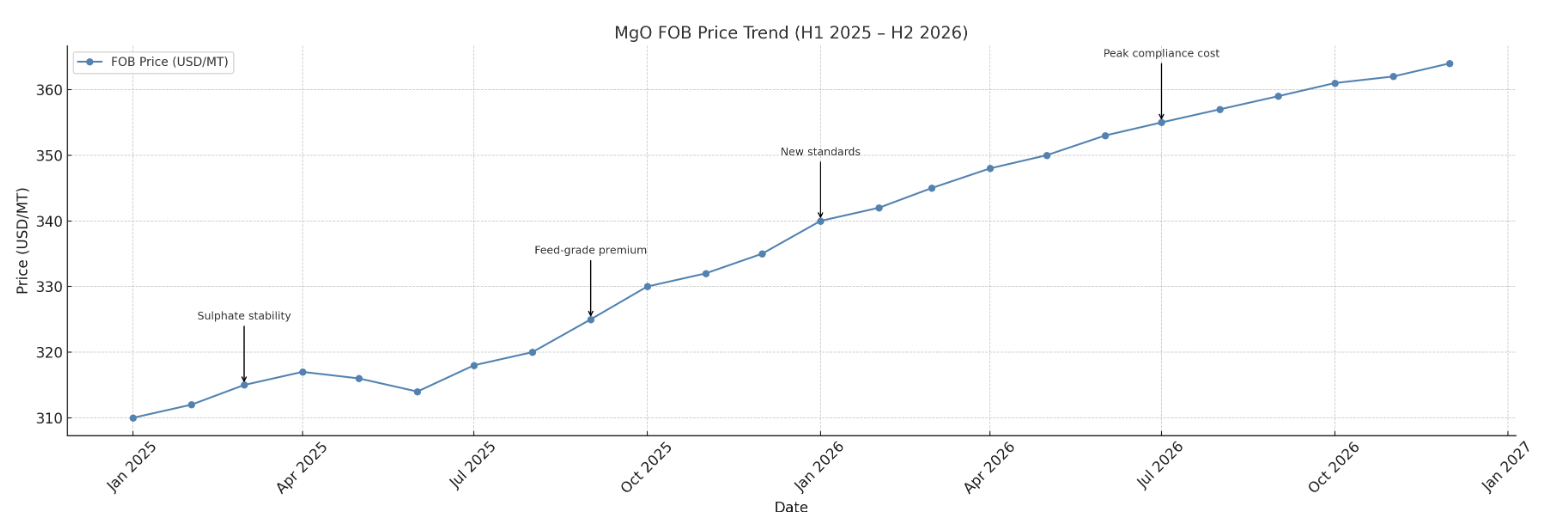
Despite notable disruptions faced by related sulphate-based fertilisers in early 2025, China’s MgO FOB prices remained unusually stable, fluctuating within a tight ±3% range from January to June, significantly less volatile than historical ranges of ±8–10%.
During this period, China sustained an average plant utilisation rate of 95.3%, with export volumes increasing 5.2% year-on-year to key destinations including Brazil, Indonesia, and Eastern Europe. This balance between steady production and rising demand helped prevent drastic price deviations.
Key stabilising factors:
4. H2 2025 Key Drivers: Cost Restructuring & Policy Divergence
4.1 Energy Transition & Compliance Costs
Liaoning’s "dual-control" energy and emissions policy targets—reducing coal and carbon intensity—have a differentiated impact on MgO production:
Switching energy sources introduces approximately 8–10% higher energy costs, per Liaoning Industry and IT Department energy-price indices, partially offset by removing low-efficiency kilns and easing downward pressure on pricing.
4.2 Raw Material Cost Pressure
Dolomite supply bottlenecks have increased local prices with regional differentiation:
|
Region |
Price (RMB/MT) |
YoY Change |
Impact on 60–92% MgO Costs |
|
Shanxi Wutai |
78–128 |
Stable |
~22% of raw material cost |
|
Liaoning Haicheng |
130–150 |
12% |
~35% of raw material cost |
Haicheng supplies ~70% of local mid-purity MgO feedstock; freight premiums raise unit costs further. Dolomite price stability in Shanxi contrasts sharply with increases in coastal Liaoning, per the China Nonferrous Mineral Association
Si-Fe used as a reducer (75# grade) in the Shaanxi market reached 5,600–5,700 RMB/MT (July 2025), with energy price increases pushing its cost share from 18% to 22%.
4.3 Feed‑Grade Demand Push
Revised national "Feed Additive Safety Standards" (effective Sept 2025) reduce permitted Pb in MgO to ≤15 ppm (down from 30 ppm).
High-grade feed MgO (80–92%) now commands a 5–8% premium, per New Hope Group procurement data, prompting feed producers to pre‑purchase in Q3 and potentially boosting H2 demand by 12–15%.
5. 2026 Structural Overhaul: Capacity Retirement & Cost Solidification
5.1 Phasing Out Inefficient Capacity
Under the updated 2026 Liaoning standards (2021–2025 industrial plan):
These closures reshape cost dynamics, reduce surplus capacity, and support pricing resilience.
5.2 Seaport Cost Differentiation
Recent Pier Authority updates:
5.3 Feed-Grade Certification Premium
The 2025 change shifted heavy metal testing from quarterly to monthly, adding ~80–100 RMB/MT in compliance and testing costs.
Certified feed-grade MgO sales carry sustained 5–8% premiums under GB 13078‑2025 standards.
6. Price Forecast Model
|
Period |
Forecast Change |
Drivers Breakdown |
|
2025 H2 |
+3–5% |
Energy costs (40%), feed-grade pull (30%), raw material (30%) |
|
2026 |
+4–6% |
Capacity withdrawal (50%), certification (30%), logistics (20%) |
7. Strategic Recommendations
If you have any questions, please fill in the relevant information. We are very willing to provide more information and a full range of services for both you and your company.